Info & Stats Window
Each discussion automatically tracks and collates information regarding contributions made in the discussion. To see this information, open the Discussion Menu and select Info & Stats (this section also appears automatically the first time you visit a discussion). To quickly open this window in a discussion, you can click the information icon located in the top left of the screen.
At the top of the window, firstly, the discussion info will appear, comprising the name and cover image of the discussion (see Discussion Images).
Underneath, a quick summary of the statistics for the discussion: the number of claims, the number of contributions, the number of votes, the number of participants, and the number of views the discussion has had.
Next, you’ll find the discussion background information (if added), which may include an introduction or key information necessary for the discussion.
Finally, you can view the complete discussion statistics per participant, sorted by the number of claims created, then the number of actions, and finally the number of votes within the discussion.
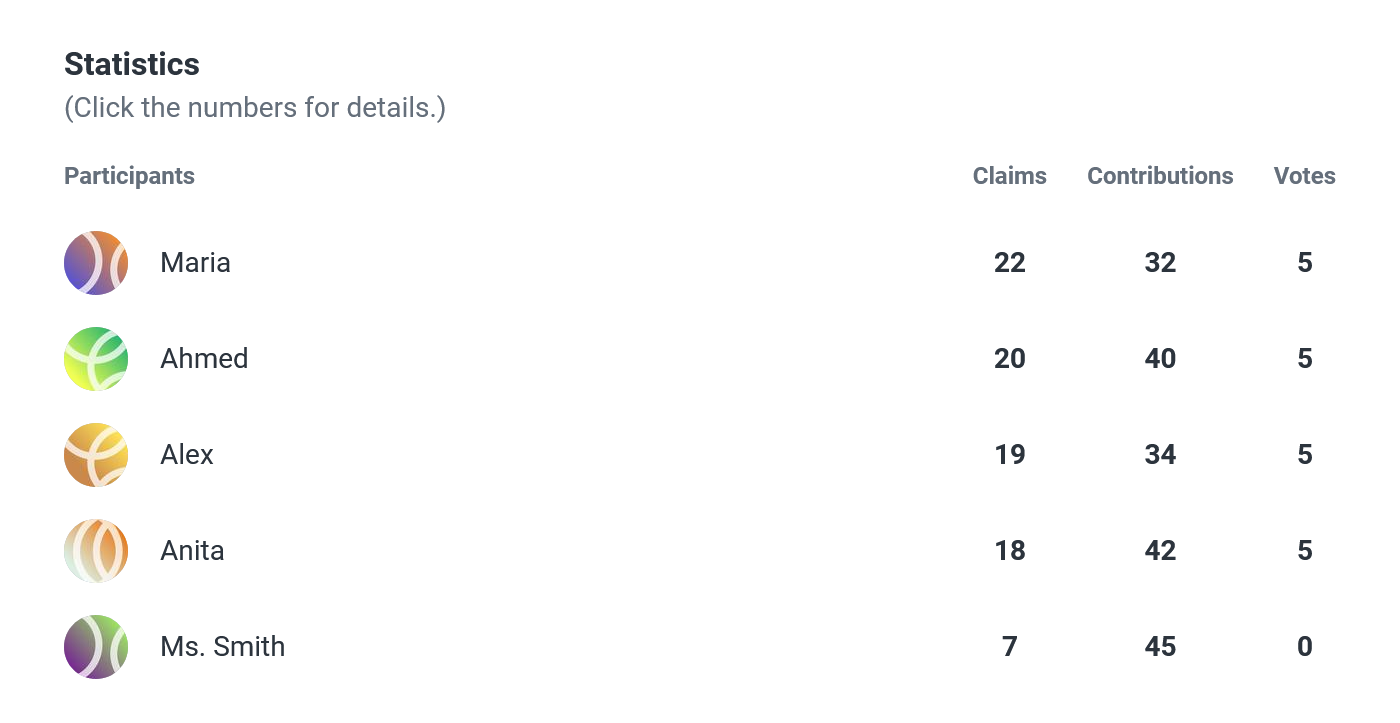
If you are not within the top ten participants, your stats will be shown at the bottom of the list. Select Show More to see all contributors in the discussion. Clicking on the number of claims or actions for someone allows you to search for their claims or comments within the discussion.